Data Collection and
Analysis
Methods
Data Collection and
Analysis
Methods
Excerpt from the methodology section of the 2022 CUH research project titled,
“An Assessment of Native Grasslands of the East-Central Virginia Piedmont,
Co-Principal Investigators, Devin Floyd and Dr. Mary Jane Epps”
“An Assessment of Native Grasslands of the East-Central Virginia Piedmont,
Co-Principal Investigators, Devin Floyd and Dr. Mary Jane Epps”
Method
COVID-19 Safety Protocols (2022-2023)
As the COVID-19 situation demands, we will follow current guidelines from the CDC.
As the COVID-19 situation demands, we will follow current guidelines from the CDC.
Preliminary Inventory of potential study sites, Strategy
Staff will continue to conduct a cursory inventory of potential high-quality survey sites using a combined method of field reconnaissance and analysis of aerial photography, geologic maps, historic maps, and LIDAR. The primary means of identifying high quality grassland sites involves driving hundreds of miles of backroad in the study area, often in an opportunistic manner. By that I mean any high-quality grasslands discovered during outings, expeditions, or site visits to locations in the region, and found mostly by chance along roadsides and in powerline rights-of-way. We have a team of 4 individuals that have practiced and studied for about 6 years to hone their expertise around identifying mixes of indicator grassland species on the drive-by. When we see something, and if we have time, each individual typically gets out and does at least a swift 2-3-minute walkthrough to affirm the indicator species, and assess for exotic species impact. We have identified more than 400 remnant grasslands in this way.
The other method is a bit more strategic, and the predictive model involves correlating grassland land-cover in aerial imagery with geologic substrates that have tendencies to support higher-quality grasslands. When that combination is crossed with historic evidence, including place names, 19th century rights-of-way, old landscapes such as those found at battlefields, or areas that weren’t intensively plowed, the probability increases. We target those regions with specific volunteer-based recon efforts. During this project we will ramp up our recon efforts to maximize both the quantity and quality of the sample sites we conduct in 2022, and to ensure we accomplish sampling that is representative of the region as a whole, both geographically, and geologically.
Beginning in May 2022 we will conduct weekly expeditions to ground-truth hypothetical grassland sites in order to build an inventory from which to choose representative sample sites for intensive study described here-in.
Sample site selection strategy
With a growing inventory of high-quality grassland sites, we will have a large set to sample from in 2022. Choosing sites for our vegetative plot studies will depend on a number of factors, including accessibility, condition, and location. Accessibility varies from one region and county to another, and depends greatly on whether or not the grassland remnant is on private land, public land, or in the public right-of-way along state roads. We have established great relationships with property owners and government agencies (i.e., parks, VDOT, etc.), and so we do not foresee access being an issue. With the exception of 2 or 3 study sites, all will be a short walking distance from a primary road.
The condition of each of our potential study sites will inform prioritization for this study. Many sites are impacted during the growing season by land managers, and when that impact makes them impossible to assess quantitatively we will forego an assessment. We are seeing a wide spectrum of grassland “health”, with diversity and exotic species impact varying from site to site even in what are perceived to be old-growth, high quality sites. All grasslands that will be studied during this project in 2021 will focus on those that are hypothesized to be high quality. At many of these sites rare species have already been confirmed. Another force that creates variety in condition is substrate. We see grasslands across the full spectrum of geology, from ultramafic to acidic, and upland to wetland. Despite some grasslands being more diverse than others naturally, we intend to sample across the spectrum to gain a better understanding of variety in the region – In other words, hypothesized diversity will not be the only deciding factor in choosing study sites. Some sites have rare or uncommon species, and those will be given priority for study when accessible.
Location is a factor in selecting study sites. Preliminary inventories of grassland remnants will produce varied level of density on the regional scale, depending historic land-use and physiography. For example, we know that the density of high-quality grasslands is elevated in eastern Cumberland and Powhatan counties when compared to the developed areas of eastern Goochland and western Henrico Counties. We intend to sample in a representative manner to including regions that have very few surviving remnant grasslands.
Additional Plot Data
While we do have specific targets for the total number of sites we will sample, we plan to augment the sample size in two ways. First, we will conduct an undetermined number of volunteer-based sample plots. We have done this in year’s past, simply because we truly love doing this type of work. Secondly, we will include data from grassland sample plots previously accomplished by staff at the Department of Conservation and Recreation. At the end of the study we should have an enormous data set that we can look at and learn from, and the totality of the work will speak volumes about the quantity, quality, and distribution of grasslands in the 9-county study area.
While we do have specific targets for the total number of sites we will sample, we plan to augment the sample size in two ways. First, we will conduct an undetermined number of volunteer-based sample plots. We have done this in year’s past, simply because we truly love doing this type of work. Secondly, we will include data from grassland sample plots previously accomplished by staff at the Department of Conservation and Recreation. At the end of the study we should have an enormous data set that we can look at and learn from, and the totality of the work will speak volumes about the quantity, quality, and distribution of grasslands in the 9-county study area.
Data collection protocols
Vegetative Sample Plots
Center for Urban Habitats (CUH) samples natural plant communities using the Relevé Method, following standard procedures employed by the Virginia Department of Conservation and Recreation's (DCR) Natural Heritage Program (VANHP). The Relevé sample method is a multidimensional method of quantifying natural plant communities. This procedure was developed by plant ecologist, Josias Braun-Blanquet, in the 20th century and it continues to this day to be one of the most detailed and comprehensive approaches recognized in the field of ecology. The Relevé method is widely employed by Natural Heritage programs throughout the United States, as it results in an exhaustive description of a given unique ecological community. It relies upon thorough multi-variate data collection within a sample plot of sufficient size to accurately represent the community being sampled (in the subject area of this proposal, the grassland types, that size is 100 square meters). During a Relevé survey, a sample plot is established within a unique ecological plant community (natural and/or anthropogenic). The Relevé approach focuses on quantifying vegetative content and structure as well as a number of physical factors such as geology, topography, soil drainage, and soil chemistry. The approach operates under the premise that all layers of a natural plant community, from the highest reaches of the canopy to below the ground surface, contribute to influencing the plant communities’ relationships to the land and to other communities. Certain species of flora have unique growing requirements, and thus they serve as “indicator species” that allow us to hypothesize about geologic conditions, land-use history, and plant community diagnosis and variation. We rely heavily on indicator species for the initial determination of possible “high quality” grassland. When several of these indicator species occur together, the probability and classification confidence level increases, for both the community type, and the quality or ecological health. For this reason, indicator species are important for the classification and naming of all natural plant communities, and for determining whether further investigation is warranted to support education or conservation. They are also among the primary influencing factors when determining where and how many plots should be executed on a given tract of land.
Center for Urban Habitats (CUH) samples natural plant communities using the Relevé Method, following standard procedures employed by the Virginia Department of Conservation and Recreation's (DCR) Natural Heritage Program (VANHP). The Relevé sample method is a multidimensional method of quantifying natural plant communities. This procedure was developed by plant ecologist, Josias Braun-Blanquet, in the 20th century and it continues to this day to be one of the most detailed and comprehensive approaches recognized in the field of ecology. The Relevé method is widely employed by Natural Heritage programs throughout the United States, as it results in an exhaustive description of a given unique ecological community. It relies upon thorough multi-variate data collection within a sample plot of sufficient size to accurately represent the community being sampled (in the subject area of this proposal, the grassland types, that size is 100 square meters). During a Relevé survey, a sample plot is established within a unique ecological plant community (natural and/or anthropogenic). The Relevé approach focuses on quantifying vegetative content and structure as well as a number of physical factors such as geology, topography, soil drainage, and soil chemistry. The approach operates under the premise that all layers of a natural plant community, from the highest reaches of the canopy to below the ground surface, contribute to influencing the plant communities’ relationships to the land and to other communities. Certain species of flora have unique growing requirements, and thus they serve as “indicator species” that allow us to hypothesize about geologic conditions, land-use history, and plant community diagnosis and variation. We rely heavily on indicator species for the initial determination of possible “high quality” grassland. When several of these indicator species occur together, the probability and classification confidence level increases, for both the community type, and the quality or ecological health. For this reason, indicator species are important for the classification and naming of all natural plant communities, and for determining whether further investigation is warranted to support education or conservation. They are also among the primary influencing factors when determining where and how many plots should be executed on a given tract of land.
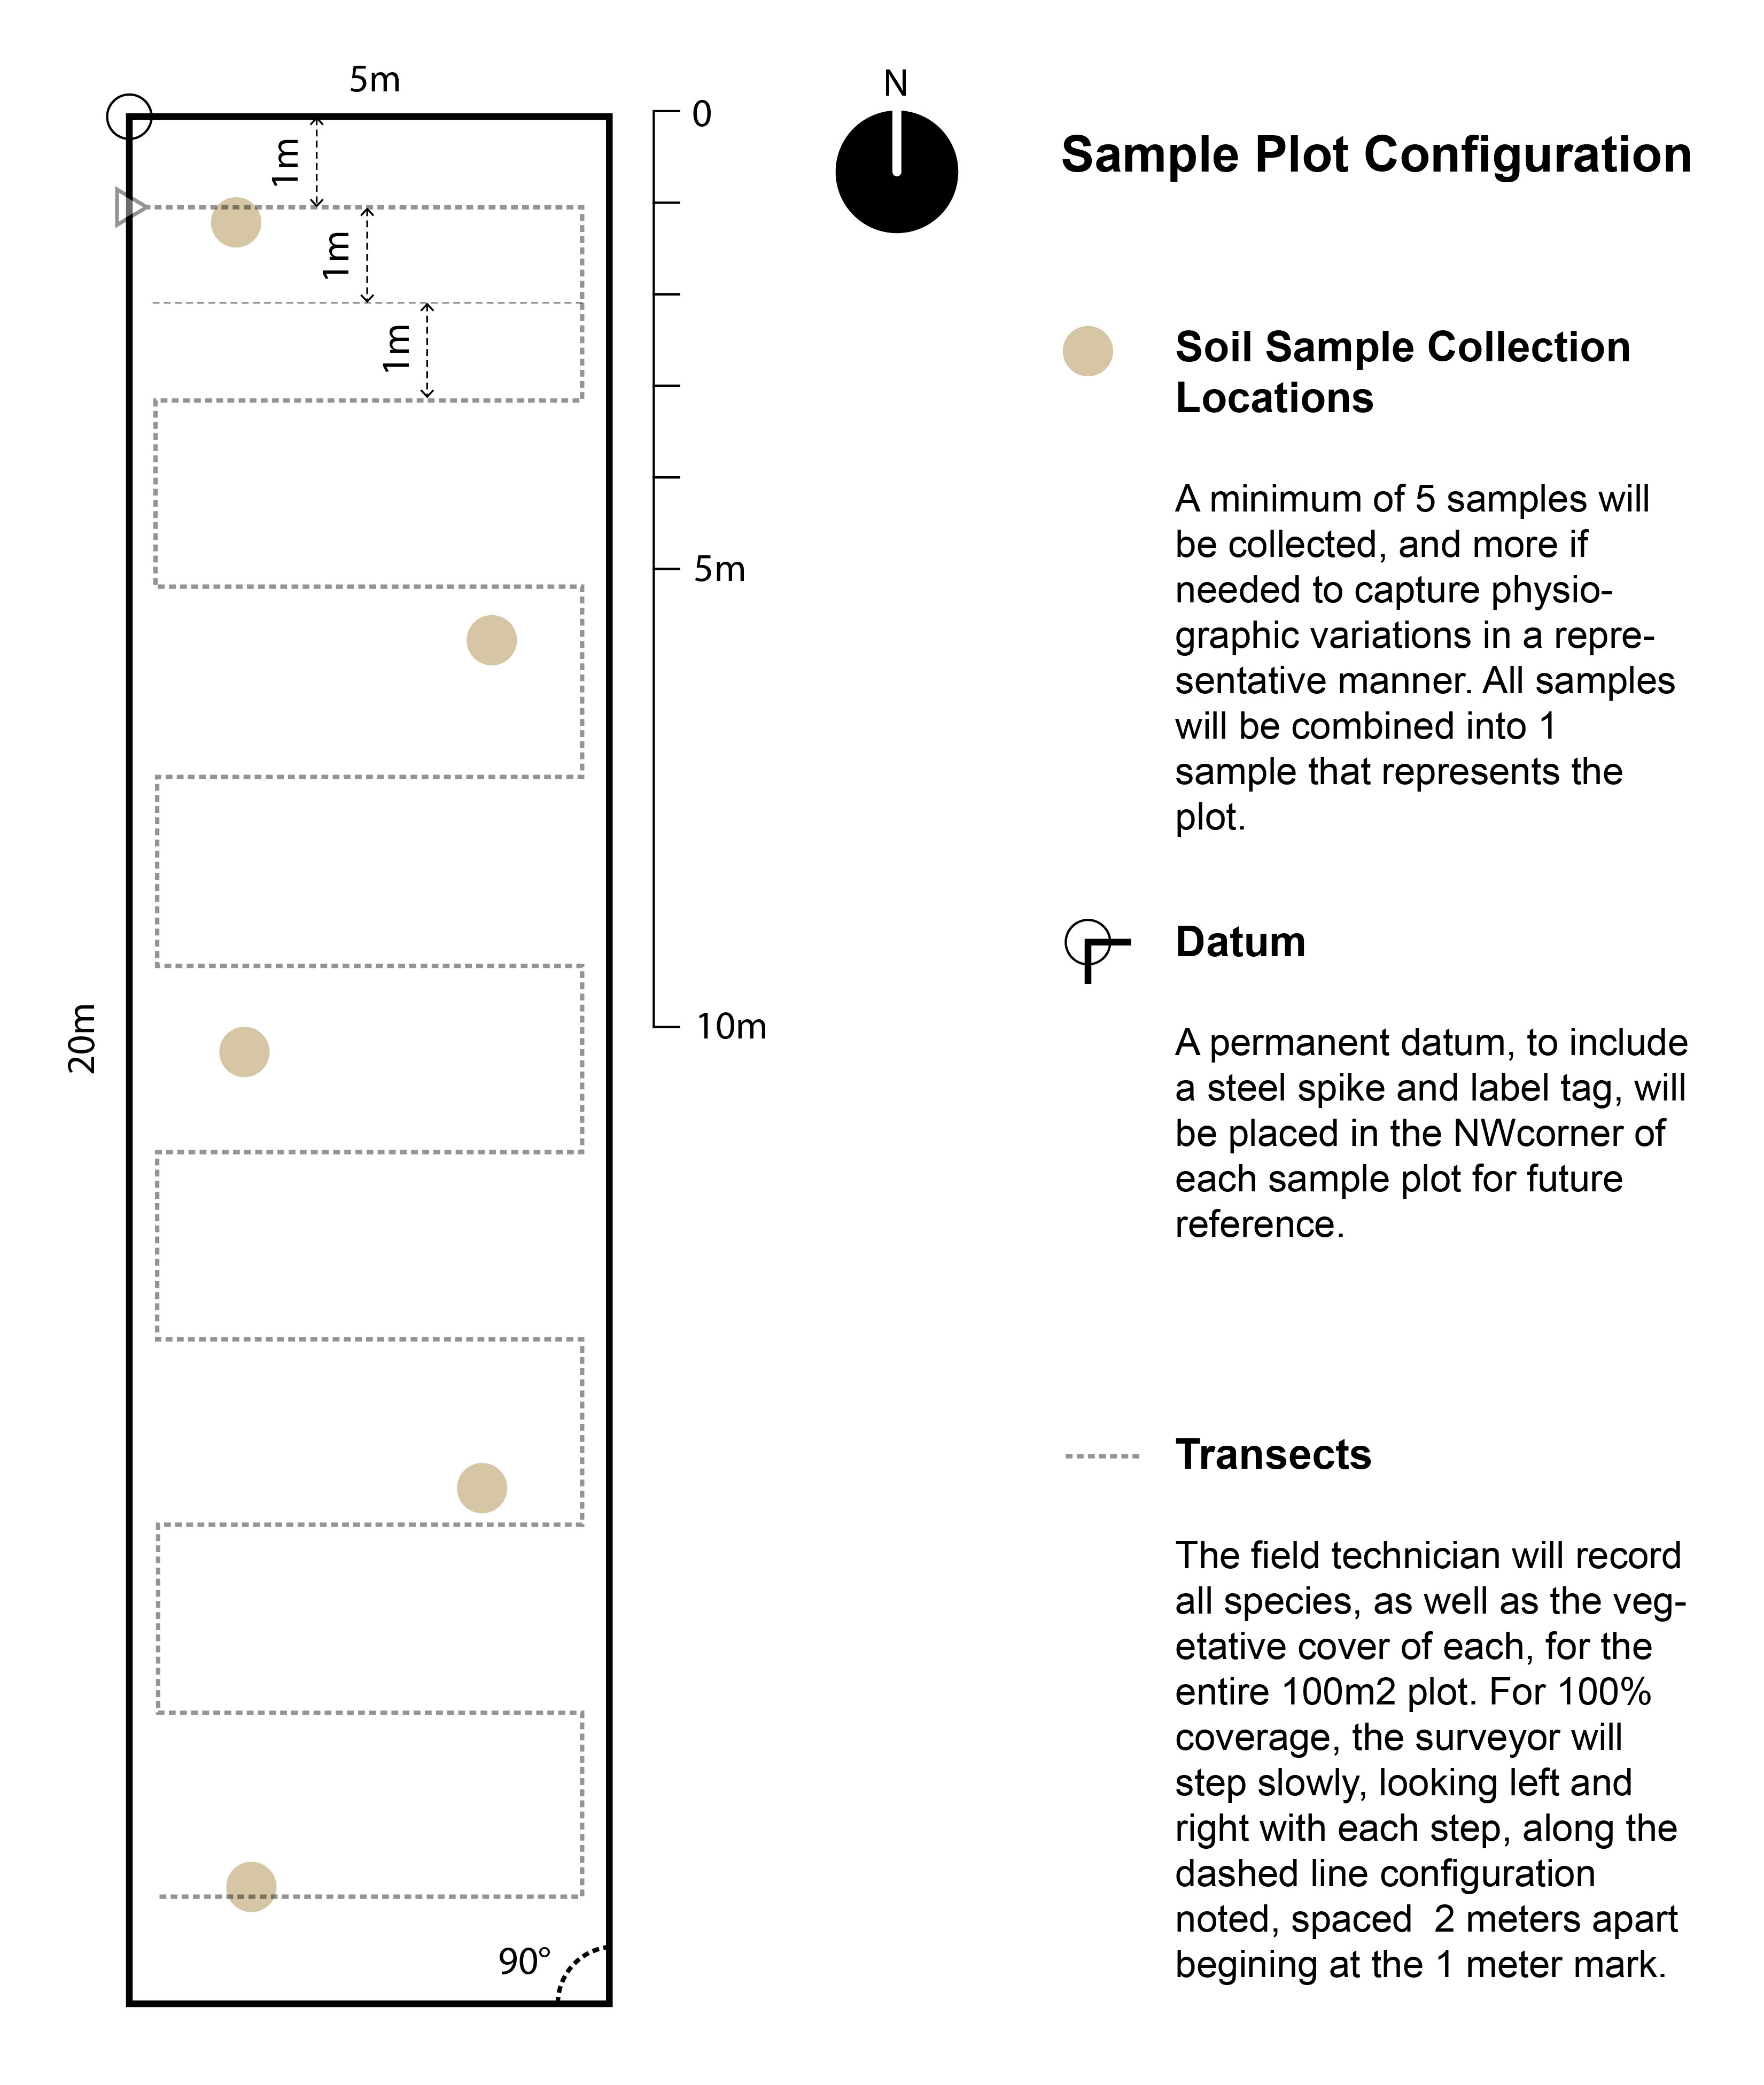
Plot Size. All assessments will be treated with 100 m2 sample plots with a standard 5 x 20 m configuration when the community size and shape allow, and other shape configurations when necessary to remain entirely within the community being sampled and at least 1 m away from the edges of the community being sampled. We are choosing this rectilinear configuration because the vast majority of the grasslands that will be the subject of this study will be in long, narrow corridors (i.e., road verges and utility rights of way). There may be some study sites that will command other dimensions, and we will address those on a case-by-case basis. But in all situations, the total square footage will remain 100 m2, and the maximum short side will not exceed 5 meters.
Semi-permanent Datum. In order to facilitate long term monitoring and re-sampling in the future, all plots will be marked (when permitted) in their northwest corner with an 8” steel spike driven into the ground and tagged with an aluminum plot label to convey date, project name, and plot number. Quantitative vegetation sampling will be conducted during the growing season between April 30, 2022 and October 30, 2022.
Physiographic Data. Within each sample plot specific physiographic data will be recorded on a standardized Field Form. This form captures general metadata and physiographic characteristics, including plot number, plot name, project name, date, county, state, recorder and surveyor names, ecoregion (Omernik, Level IV), plot elevation range, estimated community elevation range, latitude and longitude for the plot location, plot size and dimensions, plot bearing, estimated natural plant community size, plot location description, and geologic formation. General sketches, portraying a plan view and section, will be executed in the field to provide additional contextual information not captured in the form. Detailed plot-based physiographic data will be collected, including rock and mineral types present, ground surface cover materials and abundance, slope, angle of incline, aspect, landform, topographic position, evidence of disturbance, soil drainage class, soil moisture regime, soil sample notes, tree core notes (if applicable), and a field narrative covering all important aspects of the site and observations.
Environmental Data
A standard set of environmental data will be measured or estimated at each plot. The following is an overview of the data classes:
A standard set of environmental data will be measured or estimated at each plot. The following is an overview of the data classes:
Land slope, angle of incline, and aspect will be measured to the nearest percent and degree.

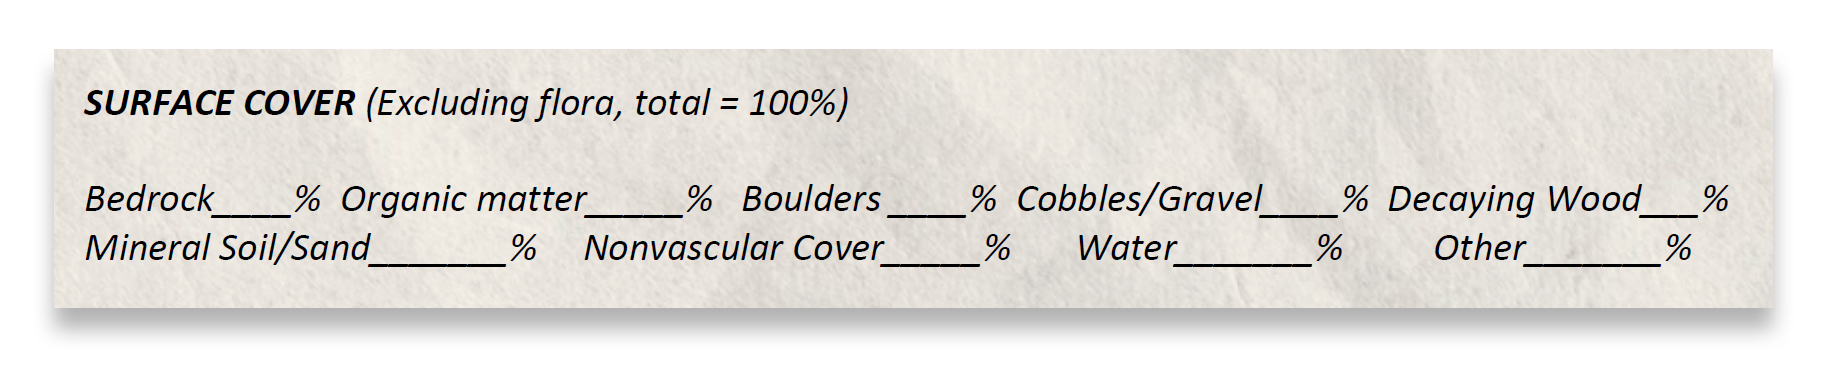
Elevation will be determined to the nearest 10 feet using a combination of GIS data and high-resolution aerial imagery. Ground Cover will be estimated as a percentage of the total plot surface area, with amounts being adjusted such that the total equals 100%.
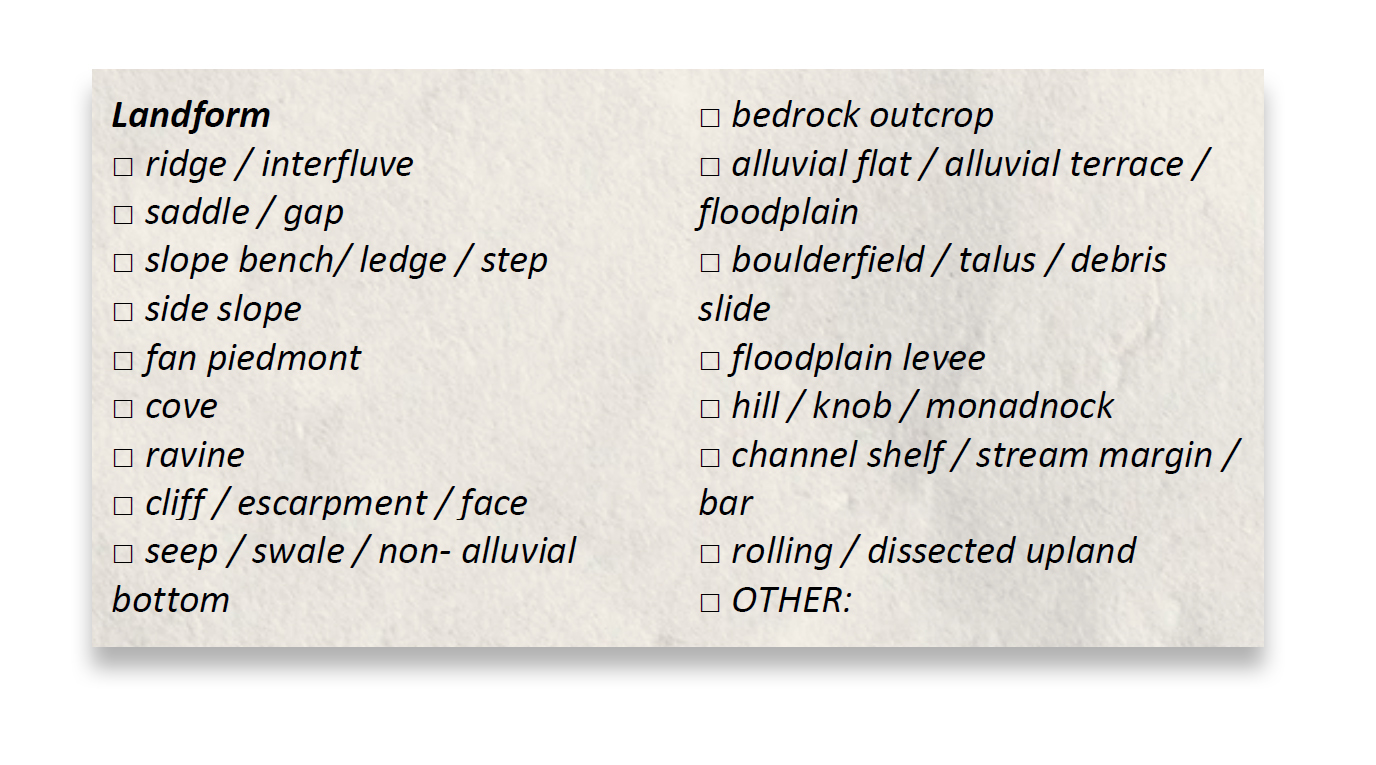
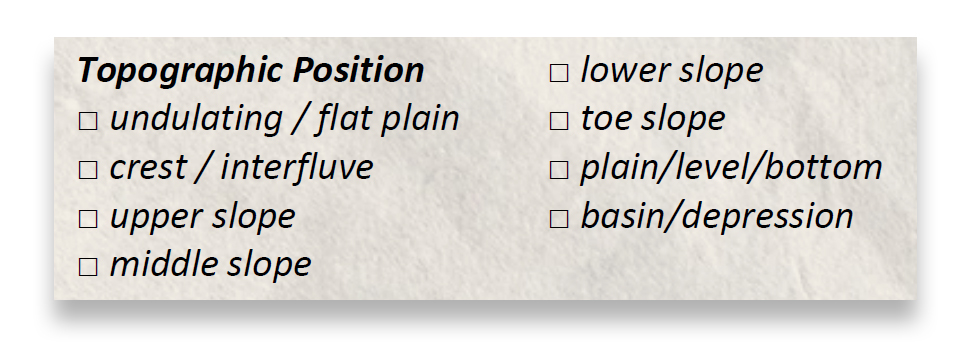
Landform will be documented as being associated with one or more of the following:
Topographic position will be noted for each sample plot, and typically includes one of the following:
Soil drainage class and soil moisture regime will be assessed using a fixed range of standard options:

Bedrock geology will be hypothesized to the greatest precision possible and recorded by using a locally segregated geological map when available, and general USGS geological map at other times. Field techs will inspect freshly broken rock and mineral samples that are available at the ground surface in order to detect site-level variation that may differ from the local trend (a frequent occurrence). Rock and mineral identifications are done in the field and rely heavily on prior knowledge of the geologic substrate in the region. Identifications will sometimes require confirmation using multivariate objective analysis with lab samples (macroscopic views and mineral type/abundance key).
Soil Data
Soil samples are collected from each sample plot. Samples are gathered from a minimum of five locations within each survey plot to ensure the samples represent the soil variety and any anomalies that are present. These small sub-samples are combined into a single 3 cup sample. Each soil sample is taken by first removing the leaf litter and any rocks or organic material that lay on the surface. With natural soil exposed, the sample is taken using a trowel to a maximum depth of 5 inches, with care to take equal amounts from the upper and lower portions of the soil column. This depth is standard when assessing soil characteristics that impact natural vegetation. All samples are packed, sealed, and labeled in transparent plastic bags in the field, and transported to our lab where they are dried for two days. They are then packaged and mailed to Brookside Laboratories, Inc., in New Bremen, Ohio for processing. We use this laboratory for all our soil analyses because Virginia’s primary entity for tracking species and natural communities (Virginia DCR-DNH) also uses that laboratory. This allows our data to be directly comparable. At the laboratory, soil samples are oven-dried, sieved, and analyzed for pH, phosphorus, soluble sulfur, exchangeable cations (calcium, magnesium, potassium, and sodium in parts-per-million), extractable micronutrients (boron, iron, manganese, copper, zinc, aluminum, in parts-per-million), total exchange capacity, total base saturation, percent organic matter, and percentages of clay, sand, and silt. Chemical extractions are carried out using the Mehlich III method. Percent organic matter is determined by loss-on-ignition. Physical analysis are determined using the Bouyoucos hydrometer method.
The test results include numbers for 25 chemical and physical characteristic data points. These combine to create powerful objective information that is independent of the vegetative and physiographic data collected in the field, and the addition of the soil data is invaluable for supporting the natural community classification process and an understanding of local variability in grassland assemblages.
Vegetative Data
We utilize a separate Vegetative Stratum Form in all study areas. One or more of these forms is used per vertical layer of the natural community. Six potential layers (aligned with the DCR-VANHP data collection protocols) are assessed for their species variety, frequency, relative frequency, vegetative cover, and minimum and maximum d.b.h. (diameter at breast height: 4.5’ above ground). Other information captured on this form includes whether the species is exotic-invasive or native, whether or not the observation was inside or outside the sample plot, and whether or not the identification of the species is in question. Plots are placed in stands of vegetation that are optimally representative of the community type being sampled, and far enough away from interfaces with other community types and/or changes in stand succession. All vascular plant species present are recorded and each species’ total cover, defined as the percentage of the ground covered by each species’ collective vertical projection, is estimated across the entire plot. Vegetative cover is assigned to each species using a nine-point scale:
In addition to documenting the presence of species and the abundance of each within the plot, the structure of the flora is quantified by measuring the size of trees, shrubs, and vines, and determining how they are distributed in three dimensions. The diameter at breast height (~4.5 feet) of each woody species above 20” tall will be measured within each layer of the canopy. Stems > 1inch are measured to the nearest tenth of an inch (.1). In order to assign a tree to a specific elevation stratum zone, we determine the height of that tree using a digital clinometer and the following double-tangent formula:
A clinometer is not used when a tree falls clearly within an already determined, and well-referenced, strata zone, but is instead employed to define the upper and lower limits of all strata listed below, and to resolve trees that are occurring closest to the interface of one of the six layers. Each species will be defined within one or more of the following layers:
We utilize a separate Vegetative Stratum Form in all study areas. One or more of these forms is used per vertical layer of the natural community. Six potential layers (aligned with the DCR-VANHP data collection protocols) are assessed for their species variety, frequency, relative frequency, vegetative cover, and minimum and maximum d.b.h. (diameter at breast height: 4.5’ above ground). Other information captured on this form includes whether the species is exotic-invasive or native, whether or not the observation was inside or outside the sample plot, and whether or not the identification of the species is in question. Plots are placed in stands of vegetation that are optimally representative of the community type being sampled, and far enough away from interfaces with other community types and/or changes in stand succession. All vascular plant species present are recorded and each species’ total cover, defined as the percentage of the ground covered by each species’ collective vertical projection, is estimated across the entire plot. Vegetative cover is assigned to each species using a nine-point scale:
1 = trace (< 0.1%), 2 = a few (<1%), 3 = 1-2%, 4 = 2-5%, 5 = 5-10%,
6 = 10-25%, 7 = 25-50%, 8 = 50-75%, 9 = 75-100%
6 = 10-25%, 7 = 25-50%, 8 = 50-75%, 9 = 75-100%
In addition to documenting the presence of species and the abundance of each within the plot, the structure of the flora is quantified by measuring the size of trees, shrubs, and vines, and determining how they are distributed in three dimensions. The diameter at breast height (~4.5 feet) of each woody species above 20” tall will be measured within each layer of the canopy. Stems > 1inch are measured to the nearest tenth of an inch (.1). In order to assign a tree to a specific elevation stratum zone, we determine the height of that tree using a digital clinometer and the following double-tangent formula:
(Tan ∠ to tree top x distance to tree) + (Tan ∠ to tree base x distance to tree) = Tree Height
A clinometer is not used when a tree falls clearly within an already determined, and well-referenced, strata zone, but is instead employed to define the upper and lower limits of all strata listed below, and to resolve trees that are occurring closest to the interface of one of the six layers. Each species will be defined within one or more of the following layers:
-
Herb layer (H): < 20 inches
-
Shrub layer (S): 20 inches to 20 feet
-
Tree layer 1 (T1): 20 feet to 33 feet
-
Tree layer 2 (T2): 33 feet to 66 feet
-
Tree layer 3 (T3): 66 feet to 115 feet
- Tree layer 4 (T4): > 115 feet
Definitions
The data collected will allow us to quantify three critical characteristics of natural community health: Species Richness, Diversity, and Exotic Species Importance.
Richness
“Richness” refers to the total number of species within a given area. Many natural plant communities have naturally low species richness (such as the forested heath habitats in the study area). In the Piedmont, forests tend to have fewer plant species than open-space grassland types such as prairies, savannas, and woodlands. There are a great number of reasons for this, but one worth noting here is that pre-Columbian native landscapes in the region were blanketed by as much grassland as forest. Enormous contiguous grasslands had thousands of years of robust, full sun, species development. One may surmise that the competition for space, nutrients, water, and light there-in resulted in enormous division of species within each genus (in fact, this bears fruit in Solidago, Dichanthelium, Desmodium and many others). Time compounds this affect, and each taxon of plant fills every little niche of the grassland landscape, both spatially and temporally, with a well-suited species. Species richness is a very important data point for comparing natural communities across the land. In combination with abundance and seasonal change, one may use richness to begin to understand biological health and the potential of a site, regardless of the condition it is in.
Floristic Quality Index (FQI)
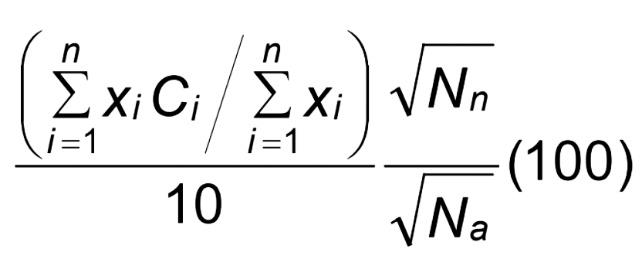
FQI is an index that combines a great number of variables in a summation formula. The components included are those that have been determined by ecologists in Virginia as being important for quantifying Natural Plant Community quality. primary factors included in the formula are: 1) relative native plant richness 2) relative native plant abundance 3) exotic species abundance and 4) C-value. C-value, also known as Conservative Value, is an index ranging from -5 to 10, and every plant species in Virginia has been assigned a number on that scale by a task force of the state’s top botanists. The scale ranks plants on their ability, or lack there-of, to tolerate significant ground disturbance (such as plowing), and whether or not the plant is an exotic invasive species or not. -5- 0 is generally reserved for non-native exotic species. The range 0-2 is reserved for weedy native species that are tolerant of ground disturbance. The 3-10 range includes only native species that are increasingly intolerant of plowing as one approaches a ranking of 10. The inclusion of this “C-value adjustment” in the FQI formula produces a ranking FQI range of -20 to 100. High quality natural grassland systems almost always fall in the range of 30-60 FQI. These sites are best characterized as being “primary grasslands” and are hypothesized to be pre-settlement remains, or so-called “remnants”. Old field vegetation growing over plowed soils (est. 0-350yrs) almost always fall to within the 0 to 20 range, and represent “secondary grassland” development. Lawns and heavily extracted or abused croplands and pastures are frequently in the -20 to 0 range because the native old growth soil components have been completely eradicated. There are many different version of the FQI formula, and the one we use appears to be best at distinguishing between high quality primary grasslands and secondary grasslands:
![]() Nn = count of native species, Na = count of all species,
Nn = count of native species, Na = count of all species,
Ci = index of conservatism for the i th species,
xi = percent cover for the i th species.
 Nn = count of native species, Na = count of all species,
Ci = index of conservatism for the i th species,
xi = percent cover for the i th species.
Exotic Species Importance
We have adopted what is referred to as the “Exotic Species Importance Value (IV)”, as devised by Gary Fleming at the Virginia Department of Conservation and Recreation’s Natural Heritage Program. This index number has proven valuable in quantifying the degree of the impact that non-native species have on a grassland community. In restoration ecology, it is very useful in creating goals, targets, and measures for ecological restoration and monitoring. This formula combines non-native species richness (# of species) and abundance (% cover) and expresses each as a relative percentage of the total population (including native species). The final number is expressed as a value on a scale of 0-1, with “0” meaning a complete absence of non-native species (extremely rare), and “1” meaning 100% non-native species and 100% non-native ground cover (extremely rare). The most common range we have identified in primary grasslands is 0-.1, and the typical range for secondary grasslands is .1 - .5. (with exceptions depending upon soil chemistry and proximity to grasslands of other type and quality).
Exotic Species Importance Value Index (IV) =
Relative Exotic Richness + Relative Exotic Abundance / 2
Relative Exotic Richness + Relative Exotic Abundance / 2
Data Analysis
Excerpt from the methodology section of the 2022 CUH research report titled,
“Zinks Mill School Road Biome, Natural Plant Community Survey. Nelson County, Virginia” , with small modifications for relevance to the Milton Airfield context (particularly in the two figures).
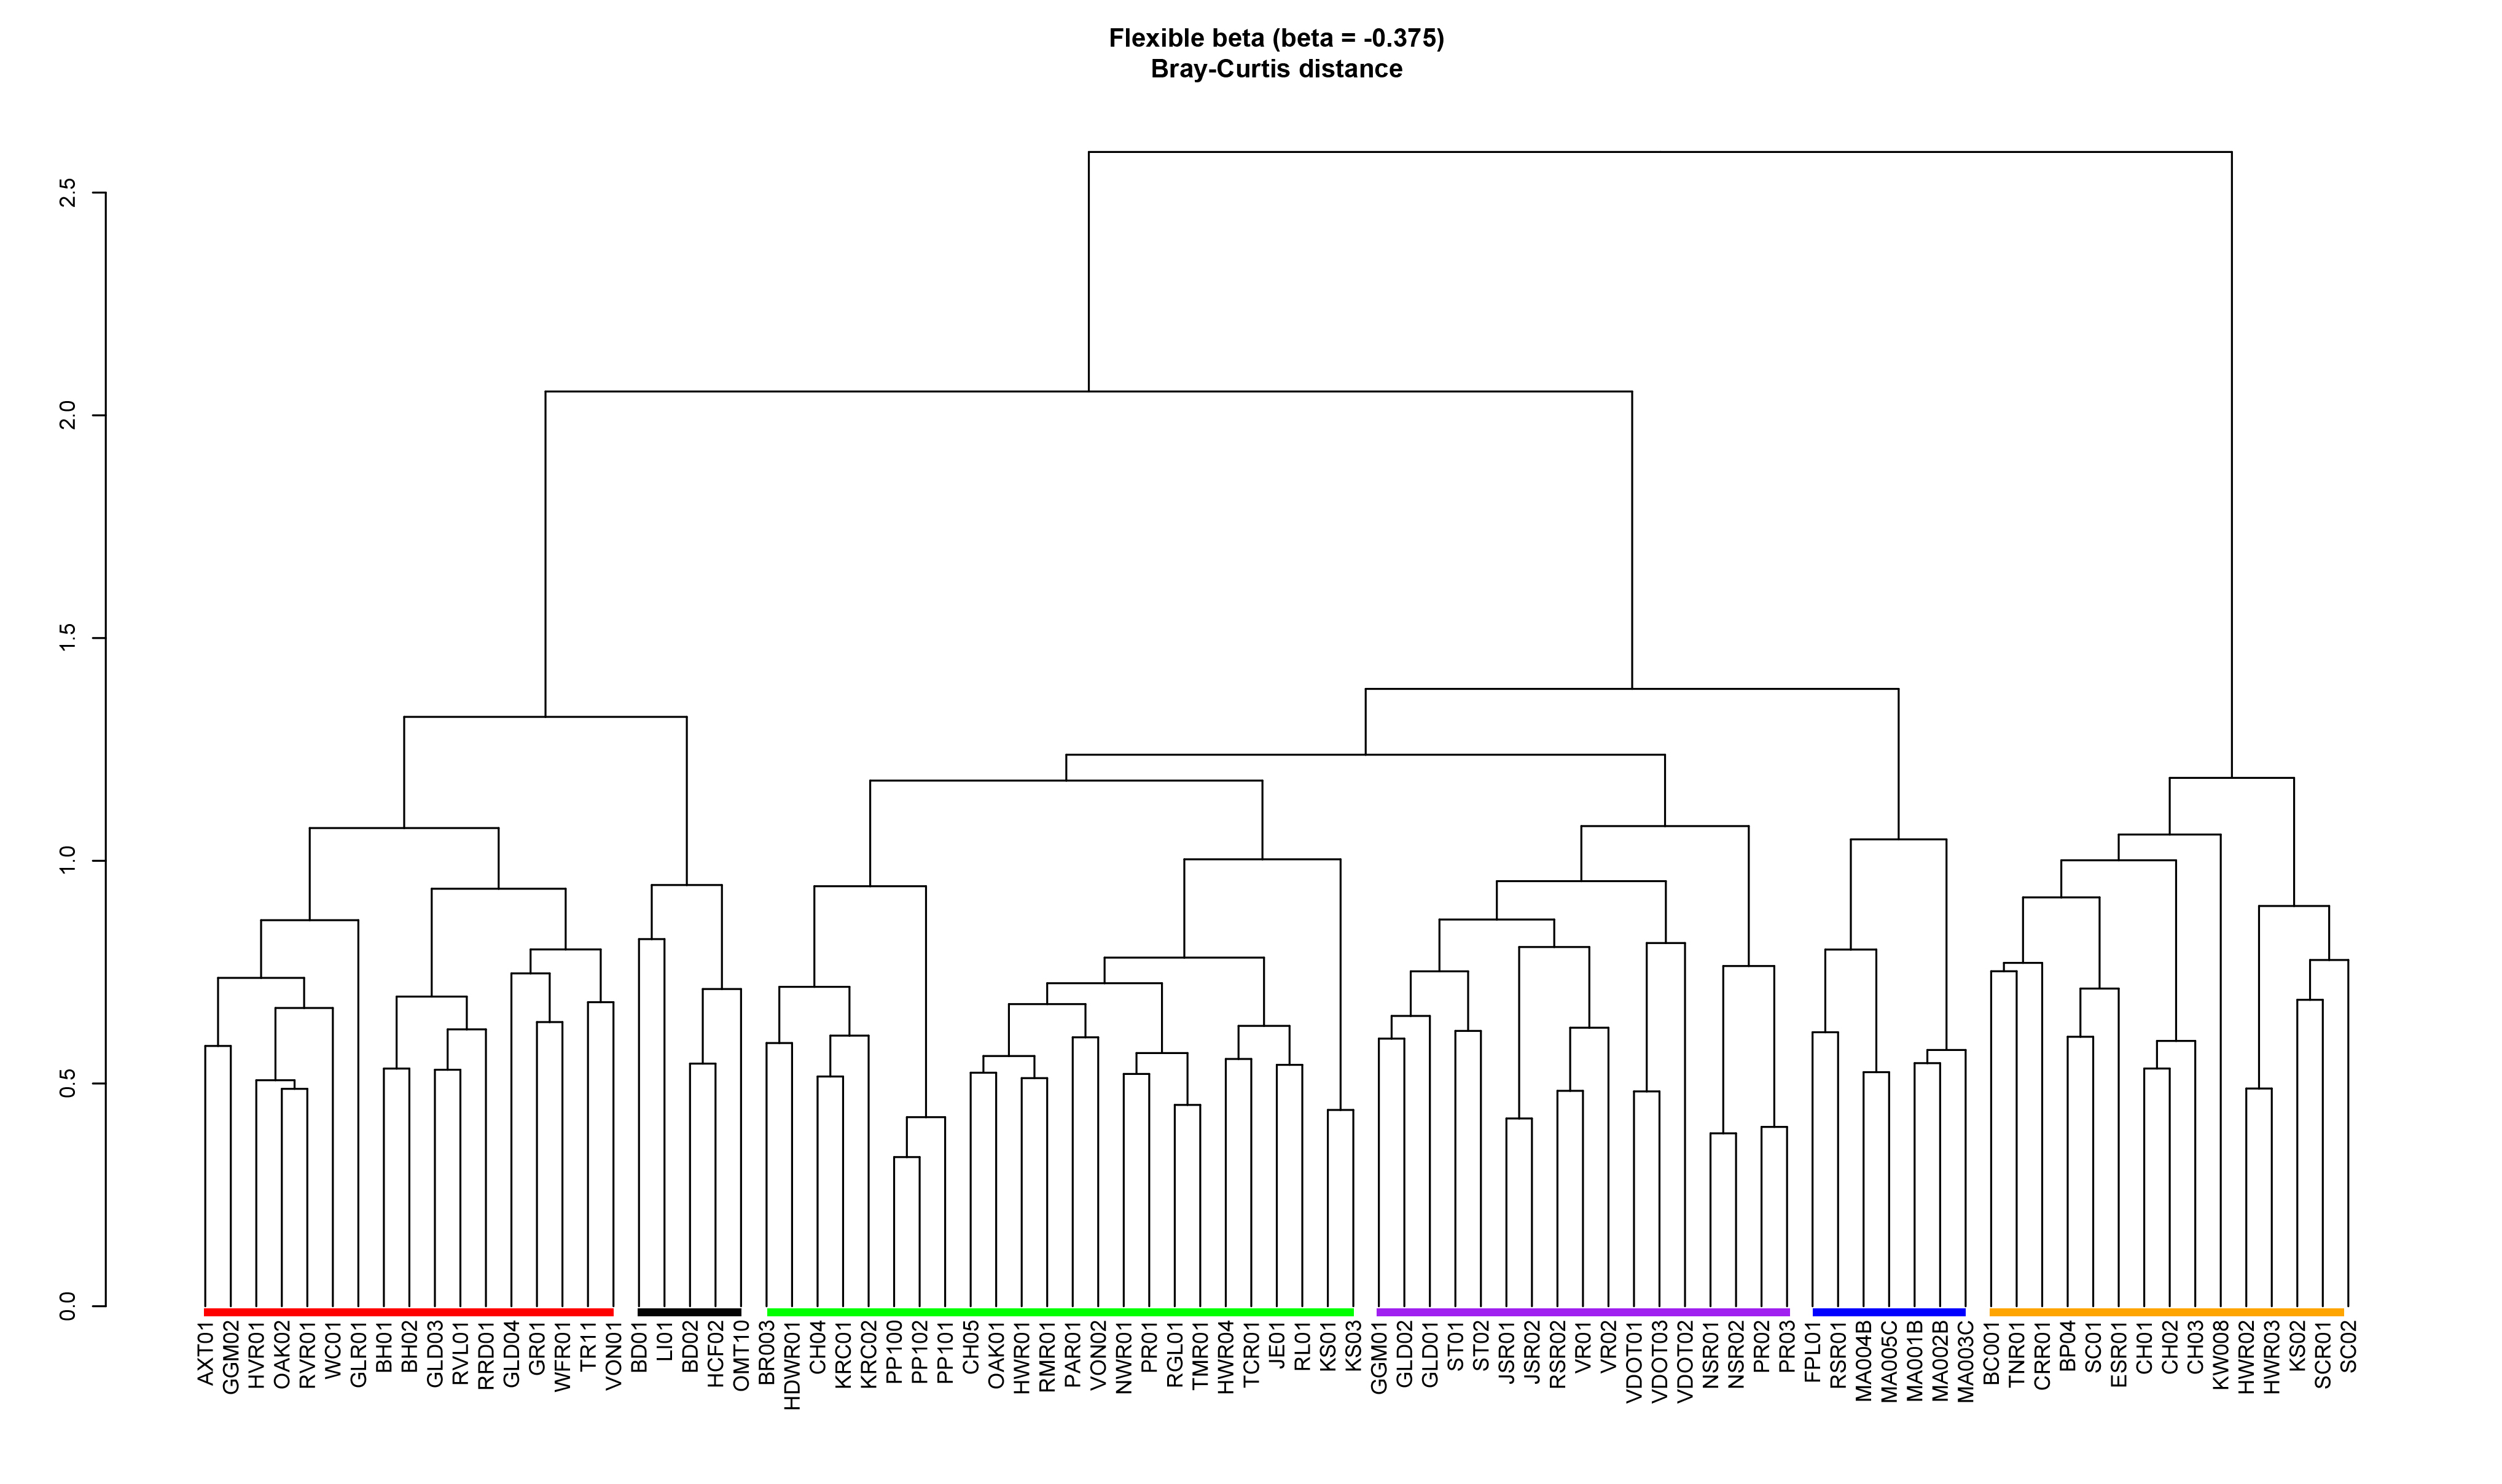
1) Hierarchical Classification of Vegetation Classes and Community Types (Figure 1 below) All statistical analysis was performed in the software package R. The initial step was a classification of the plots via cluster analysis, a statistical method that groups samples according to (in this case) floristic composition. A hierarchical agglomerative approach was taken for the clustering, using the Bray-Curtis dissimilarity coefficient and the Lance-Williams flexible-beta sorting strategy. These are methods that have proven well-suited to analyzing vegetation data, and have been used in the most rigorous and successful Virginia studies that are focused on objectively identifying unique vegetation assemblages and relationships between them. Compositional data for each plot was derived by transforming raw cover class scores into percent cover values, with one value assigned to each species. The clustering results are then visualized using a dendrogram or “tree diagram,” an effective way of displaying hierarchical relationships. Here the Y-axis represents the dissimilarity score, so that the line joining two plots corresponds to the relative degree of dissimilarity between them. Closely grouped plots are considered to be very floristically similar. See Figure 1 Below for a dendrogram showing degrees of dissimilarity between all our grasslands vegetative plots accomplished in 2021 (included those at the Milton Airfield.
2) Summary of Community Type Structural and Environmental Characteristics
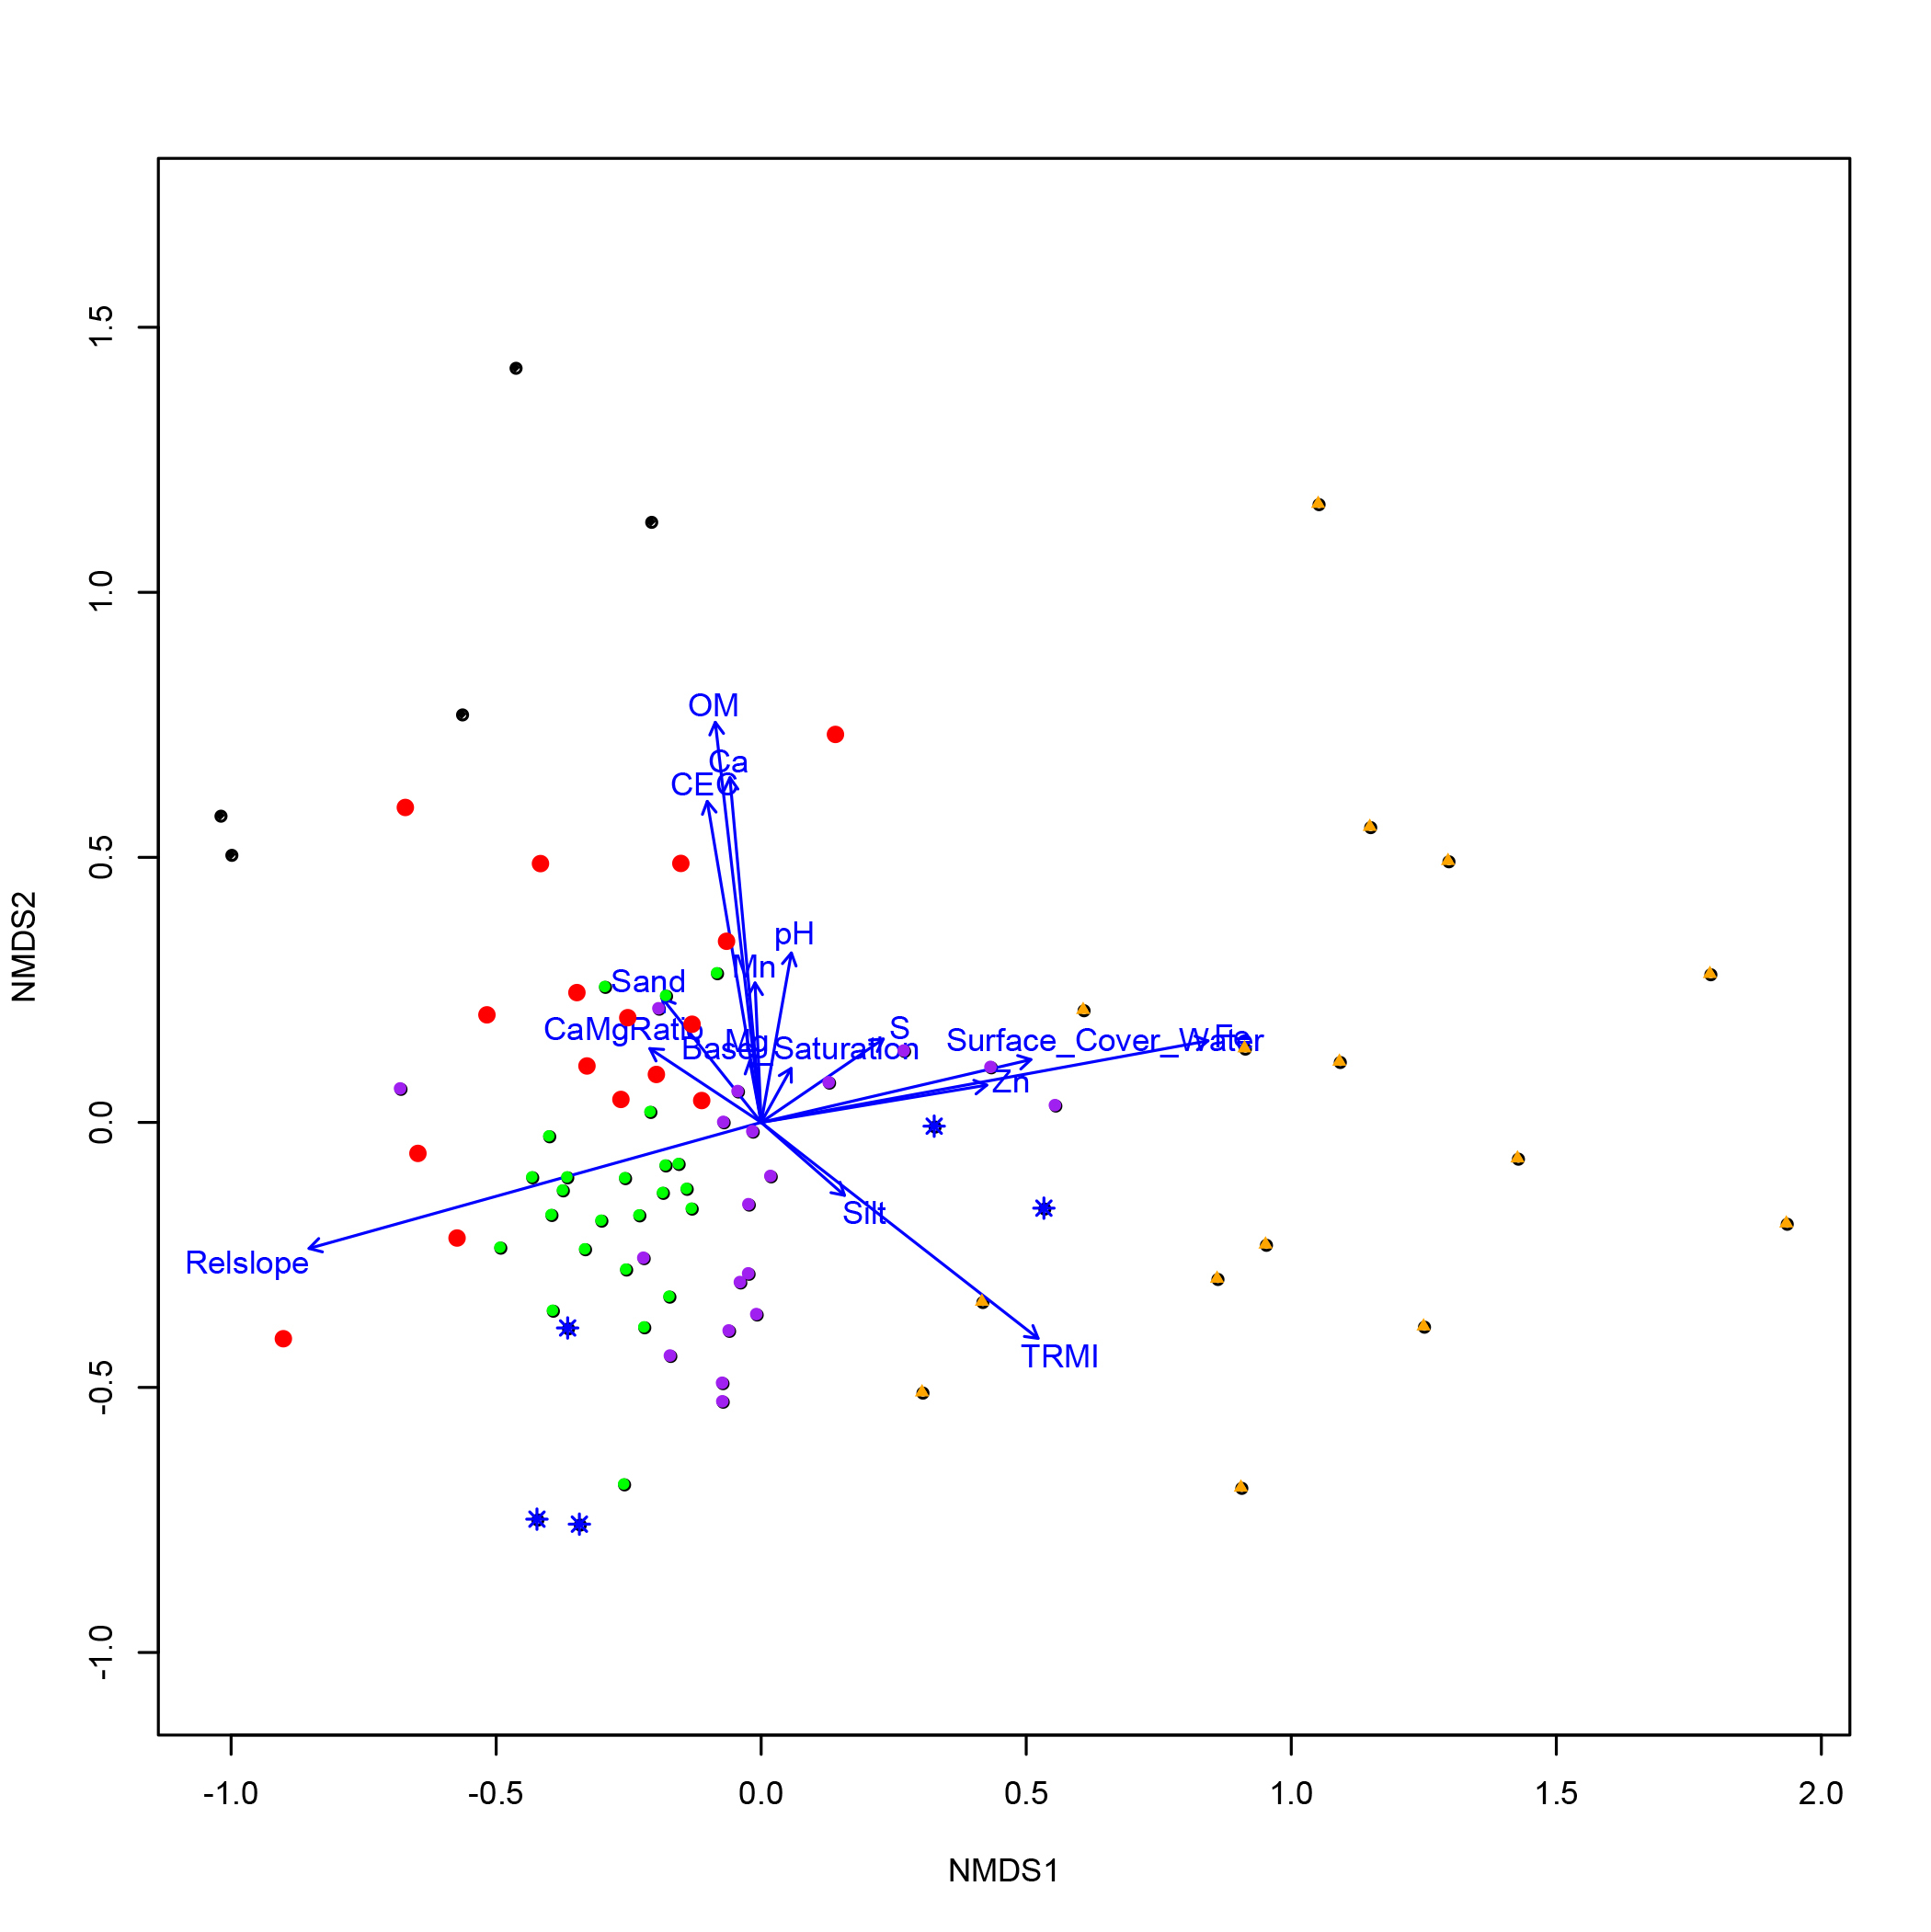
The next step was to perform ordination, a method of visualizing the similarity between samples in a multivariate dataset in a lower-dimensional space. This was done both to validate the clustering results and to reveal patterns that may not have been evident therein, as well as to assess the relationships between floristic composition and environmental gradients. The method chosen was non-metric multidimensional scaling (NMDS), a popular tool for explaining variation in vegetation data. Again, the Bray-Curtis coefficient was used to compute the initial matrix of dissimilarities between samples.
The result of the ordination was a two-dimensional plot containing all vegetation plots arranged according to compositional similarity. Finally, a suite of environmental variables were collected or computed for each plot, including variables capturing soil chemistry and texture as well as metrics representing topographic position and moisture availability. These were overlaid on the ordination plot using a vector-fitting algorithm that maximizes the correlation between each environmental variable and the two-dimensional sample coordinates. Strength of correlation for each variable is represented by the length of the corresponding vector.